Electricity vs Natural Gas Generation
For many utility customers, it’s easy to assume that electricity costs have remained relatively flat for years — but the total number on your bill doesn’t tell the whole story. In fact, the transmission and distribution portion of utility rates has risen dramatically over the last 10 years while the energy (or commodity) portion has fallen steadily due to the decline in natural gas prices.
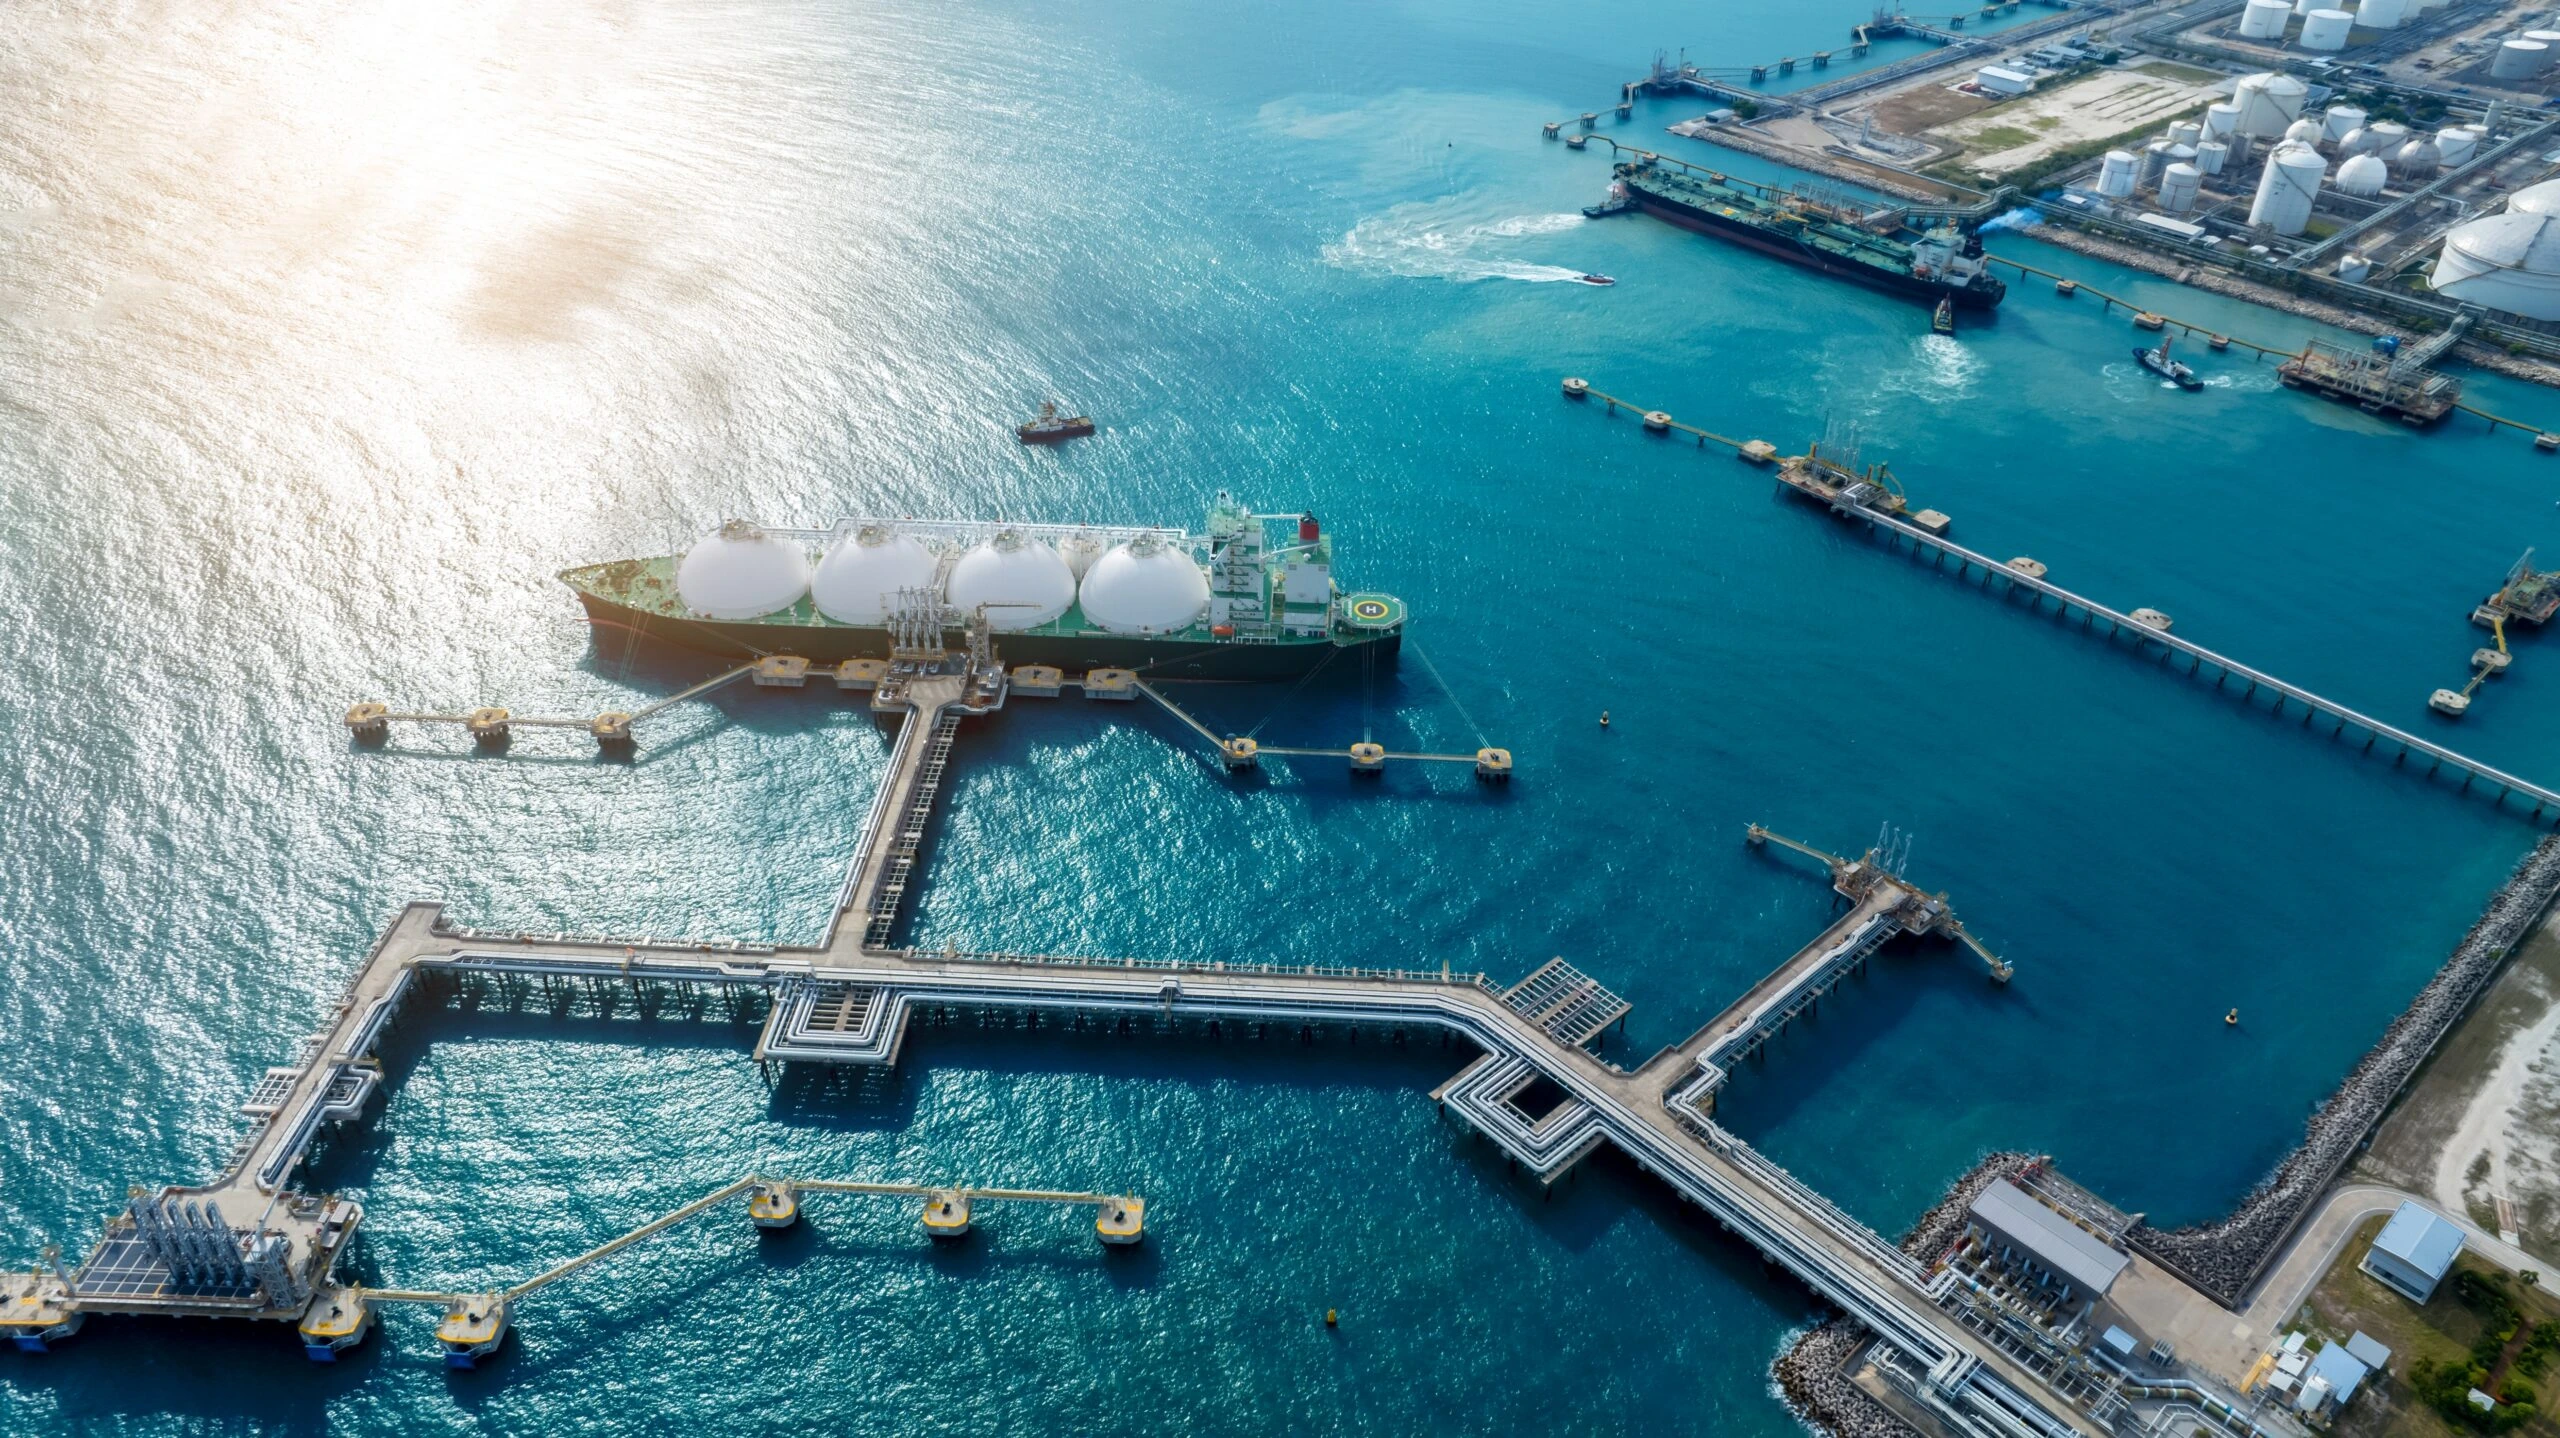
On-site power generation, using natural gas engines or turbines for baseload power, provides a way to avoid rising utility costs. Whether purchased by the customer or financed using an energy services agreement (ESA), the on-site generation system replaces the transmission and distribution costs of the utility.
That said, many of our clients are concerned about what happens when natural gas prices for their CHP system rise (or fall), and whether that will affect their savings. The short answer is because natural gas and electricity commodity costs are historically closely correlated, customers will experience consistent savings relative to the utility, regardless of whether grid electricity prices rise or fall. The more detailed answer involves an explanation of how electricity markets work.
How Are Utility Electric Prices Set?
Electric prices are made up of three components: transmission & distribution (T&D) costs, taxes & surcharges, and commodity costs.
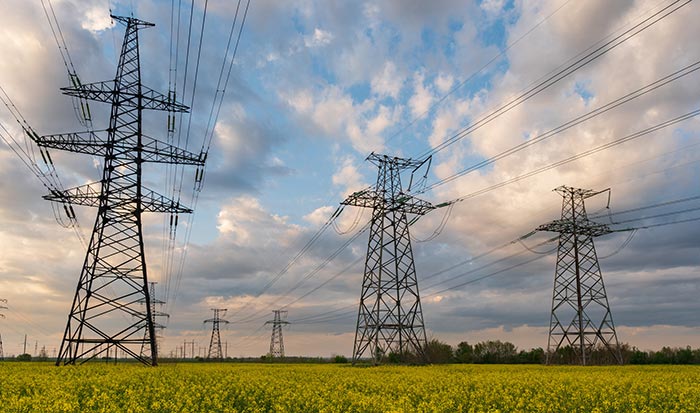
Transmission & Distribution
These charges are the utility costs associated with delivering electricity over the grid via the transmission lines that run across the country and terminate in our homes and workplaces. T&D costs can comprise about two-thirds of customer energy bills. These costs have been rising faster than inflation for years and are projected to continue rising due to investments in grid infrastructure and cost recovery from catastrophic events:
- Investment in grid infrastructure: Maintenance and replacement costs for utilities are rising because much of the grid infrastructure has already aged past its intended lifetime. About 70% of transmission lines are 25 years or older. For instance, PG&E’s transmission towers were found in 2019 to be 68 years old on average.
- Catastrophic events: Some utilities need to pay large liabilities due to catastrophic events — the PG&E wildfires, Duke Energy coal ash cleanups, and the Fukushima Daiichi nuclear disaster are recent examples.
Utility spending on T&D rose 54% between 1997-2018.5 For instance, the three investor-owned utilities in California just requested rate increases of 12.4% (PG&E), 14.7% (SCE), and 10.03% (SDG&E) for 2020 to fund extensive wildfire mitigation measures. Even on the East Coast, without the burden of wildfire recovery, ConEd requested an 8.6% rate increase for large users in 2020 (and settled on 4.6%). Taxes & Surcharges State and local taxes are expected. Most states have also implemented surcharges to support green state incentives, balance the cost of shutting down and decommissioning existing generation assets such as aging nuclear power plants, and cover infrastructure upgrades needed to manage small distributed energy connections such as solar, CHP, and fuel cells. Commodity This portion of electric rates, also known as supply or generation costs, is the per-kWh cost of generating power at the power plant. Commodity prices are determined by wholesale market prices. In deregulated states, this price is transparent as customers can purchase electricity directly from independent power producers in the wholesale marketplace. Between T&D and commodity costs, it’s the T&D rates that are rising rapidly, far more quickly than inflation in most markets. For example, a large hospital powered by Southern California Edison would have seen an average increase in T&D costs of 4.5% each year between 2011 and 2018, even though commodity costs fell by 0.9% per year and state surcharges were essentially flat. T&D rates soared by a total of 35% over the seven-year period while commodity costs dropped 6%.
How Is the Commodity Portion of Electric Prices Tied to Natural Gas?
While transmission and distribution prices are tied to physical infrastructure costs and regulated by state agencies, such as the Board of Public Utilities in New Jersey, the commodity portion is closely correlated with the cost of natural gas because of the unique role that natural gas plays in the wholesale electricity generation market.
Following the U.S. shale revolution about 15 years ago — when new hydraulic fracturing and drilling technologies increased oil and gas production — natural gas became an increasingly abundant fuel for power generation, taking the lead from coal in 2016. In 2018, natural gas generated 35% of the nation’s electricity. But the economic power of natural gas actually has less to do with its dominance in the field and more to do with the energy bidding process.
Grid electricity is priced on an hourly basis, using a day-ahead bidding auction. In this model, each generator on the grid puts in a bid with a price and quantity, and bids are accepted starting with the cheapest option until the grid’s electricity demand is satisfied in each hour. All generators then receive the “clearing price,” that is, the price set by the last bidder to meet the demand. Because generation sources are selected in the auction in order of marginal cost, hydroelectric (dams), renewable, and nuclear generators with low operating costs (little or no fuel requirements) tend to be dispatched first. Large nuclear and hydro plants are not effective at ramping up production quickly and are designed to run at full output continuously. Solar and wind are not able to ramp up and down based on demand either, as they depend on the weather to fuel their production. Coal has become more effective as a peaking plant fuel source but the costs of coal are less and less able to compete with the low cost of natural gas.
Natural Gas Is the Marginal Production on the Grid and Therefore Sets the Hourly Price
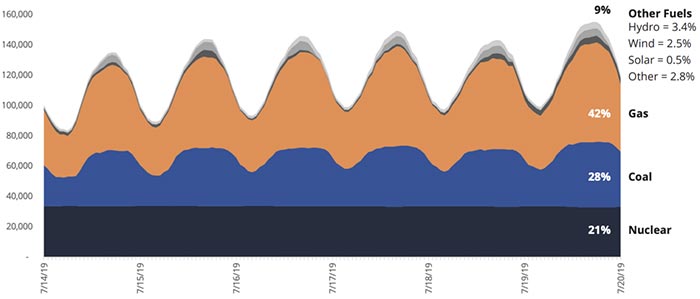
This sample dispatch for the PJM interconnection, which covers much of the Mid-Atlantic and extends into the Midwest, shows fairly flat nuclear production, a slight increase in coal production, and dramatic natural gas marginal production during peak demand periods.
Natural gas plants provide so much marginal capacity partly because of price, but primarily because they are flexible. Gas plants and some coal plants serve as “peaker” plants, meaning they can cycle on and off at short notice to meet fluctuating peak energy demand throughout the day. That’s why natural gas generation rises and falls during the day, while other sources remain at stable levels.
Because wholesale power prices are set by the generation asset that is dispatched last, natural gas peaker plants and the price of the fuel input, natural gas, have an outsized effect on the overall price of electric commodities. As shown by the cost of electricity and natural gas in Massachusetts, the cost of electricity has been very highly correlated with the price of natural gas since 2005
Gas and Electric Markets Are Highly Correlated
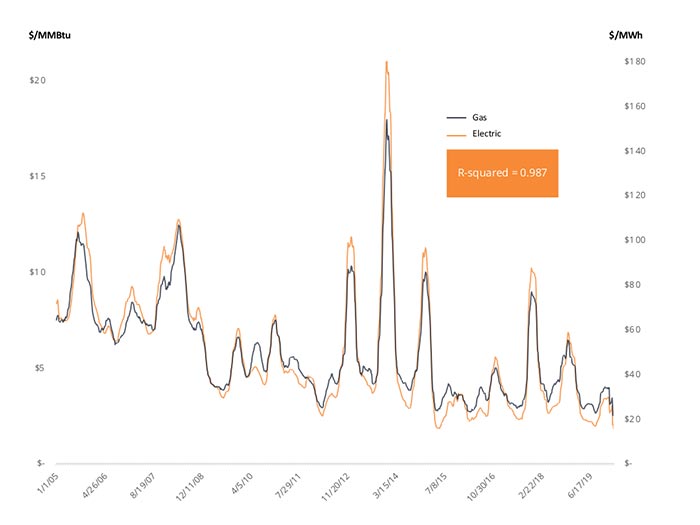
Gas and Electric Commodity Costs Rise and Fall in Parallel With Each Other.
This correlation holds true across the country, looking at the effect of natural gas prices on electricity prices in more than 33 different markets over 15 years. On a scale where zero is no correlation and 1.0 is perfect correlation, these correlations range between 0.81 in the Texas region to 0.96 in the Northeast, and are stable over time.
We Analyzed 33+ Publicly Traded Pricing Points Over 15 Years Across the Country and the Correlation Is Consistent

What Does This Mean for Cogeneration Customers?
As natural gas prices have decreased, electricity commodity prices have also decreased across the U.S. But electricity consumers who remain connected to the grid for 100% of their energy needs have to contend with increasing T&D rates. Those who switch to on-site power generation can reduce the T&D costs that are passed down to them from the utility, and will likely see increased savings over time as additional utility capital improvements are approved by the local public utility commission and passed on to energy consumers through higher utility rates.
What’s more, cogeneration customers can rest assured that their savings relative to utility-supplied electricity will remain fairly constant, because even if the price of natural gas goes up or down, the electric commodity prices will follow. In addition, for CFOs and energy buyers, on-site generation plus a long-term natural gas contract that locks in gas costs can provide energy cost certainty for up to 10 years.
Share on
About us
Engineered for Performance. Built for the Long Term.
Unison Energy combines capital strength, technical expertise, and operational discipline to deliver resilient power for facilities across industries.
Insights shaped by over a decade of experience
Explore more perspectives on energy costs, resilience, and on-site generation from the Unison Energy team.
View All Blogs